Build a Real-Time Dashboard in 10 Minutes with AWS Kinesis and Managed Grafana
Want to see your data come to life, updating in real time? Building a live dashboard might sound complicated, but with AWS Kinesis and Managed Grafana, it’s surprisingly quick and easy. In this guide, we’ll show you how to set up a basic real-time dashboard in about 10 minutes.
What You’ll Need:
- An AWS account.
- Some data that can be streamed (e.g., application logs, sensor readings, website clicks).
- A few minutes!
The Magic Behind the Scenes:
Before we dive in, let’s quickly understand the key players:
- AWS Kinesis: Think of Kinesis as a super-fast delivery service for your data. It can collect and process huge amounts of streaming data in real time. We’ll use Kinesis Data Streams to ingest our data.
- Amazon Managed Grafana: Grafana is a popular open-source platform for visualizing data. Amazon Managed Grafana is a fully managed service that makes it easy to create and share beautiful dashboards without managing the underlying infrastructure.
Let’s Get Started (The 10-Minute Guide):
Step 1: Create a Kinesis Data Stream (5 minutes)
- Go to the AWS Management Console and search for “Kinesis.”
- Click on “Data Streams.”
- Click “Create data stream.”
- Give your stream a name (e.g.,
real-time-data). - For “Provisioned capacity mode,” select “On-demand” for simplicity (it scales automatically).
- Click “Create data stream.” Your stream will be ready in a few minutes.
Step 2: Send Data to Your Kinesis Stream (2 minutes)
To see your dashboard in action, you need to send some data to your Kinesis stream. The way you do this will depend on your data source. Here’s a simple Python example using the AWS SDK (Boto3). Make sure you have the AWS CLI configured with appropriate credentials.
First, install the Boto3 library:
pip install boto3
Then, run this Python script (replace 'your-stream-name' with the name you chose in Step 1):
import boto3
import time
import json
import random
from datetime import datetime

kinesis_client = boto3.client('kinesis', region_name='your-aws-region') # Replace with your AWS region

stream_name = 'your-stream-name'

while True:
timestamp = datetime.utcnow().isoformat() + 'Z'
temperature = random.randint(20, 30)
humidity = random.randint(50, 70)
data = {
'timestamp': timestamp,
'temperature': temperature,
'humidity': humidity'
}
partition_key = 'sensor-1' # You can use something relevant to your data
<pre><code>   kinesis_client.put_record(
       StreamName=stream_name,
       Data=json.dumps(data),
       PartitionKey=partition_key
   )
   print(f"Sent data: {data}")
   time.sleep(1)  # Send data every 1 second
</code></pre>
Important: Replace 'your-aws-region' with your AWS region (e.g., us-east-1) and 'your-stream-name' with the actual name of your Kinesis stream. Run this script to start sending sample data.
Step 3: Set Up Amazon Managed Grafana (2 minutes)
- Go back to the AWS Management Console and search for “Grafana.”
- Click on “Amazon Managed Grafana.”
- If you haven’t created a workspace yet, click “Create workspace.”
- Give your workspace a name.
- Choose your authentication method (AWS IAM is a good option). Follow the prompts to configure access.
- Review and click “Create workspace.” It might take a few minutes for the workspace to be active.
- Once active, click the “Workspace URL” to open your Grafana instance.
Step 4: Configure a Data Source in Grafana (1 minute)
- In your Grafana workspace, click the “Configuration” (gear icon) in the left sidebar.
- Select “Data sources.”
- Click “Add data source.”
- Search for and select “CloudWatch.” (Even though we’re using Kinesis, we’ll use CloudWatch to query metrics about our Kinesis stream, which can give us real-time insights like the number of records coming in).
- Give your data source a name (e.g.,
CloudWatch). - For “AWS Region,” select the region where your Kinesis stream is located.
- For “Authentication provider,” choose the method you configured during workspace creation (usually “AWS IAM Roles”).
- Click “Save & test.” You should see a “Data source is working” message.
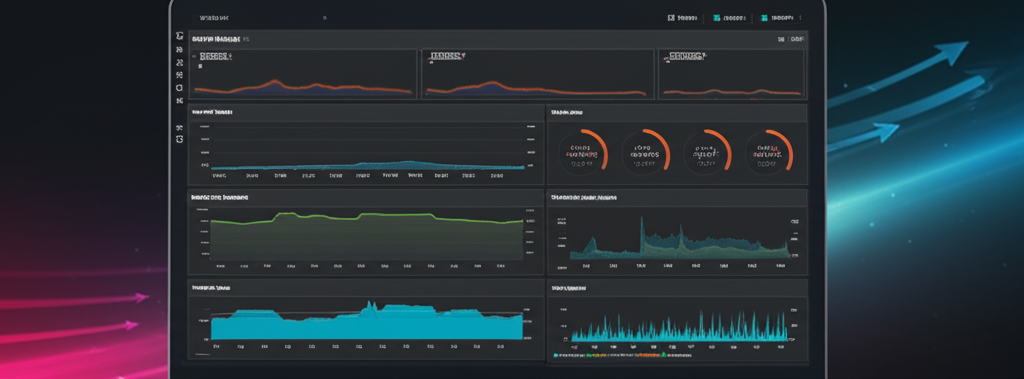
Step 5: Create Your Real-Time Dashboard (Optional, for Kinesis Metrics)
While direct visualization of data within Kinesis via Managed Grafana requires an intermediary processing layer (like Kinesis Data Analytics or Lambda writing to a database that Grafana can then query), you can still create a real-time dashboard to monitor your Kinesis stream’s health and activity using CloudWatch metrics.
- In Grafana, click the “+” icon in the left sidebar and select “Dashboard.”
- Click “Add new panel.”
- In the query editor, select the CloudWatch data source you just created.
- For “Namespace,” select “AWS/Kinesis.”
- For “Metric name,” you can choose metrics like:
GetRecords.Bytes(amount of data being read)PutRecords.Bytes(amount of data being written)PutRecords.Success(number of successful write operations)GetRecords.Success(number of successful read operations)
- Group By “StreamName” and select your Kinesis stream name.
- Choose a visualization (e.g., “Time series” for trends).
- Adjust the “Ref. ID” to
A. - Click “Save” to save your dashboard.
Now you have a basic real-time dashboard showing activity on your Kinesis stream!
Going Further:
To visualize the actual data you’re sending through Kinesis (like temperature and humidity in our example), you would typically:
- Process the Kinesis stream: Use AWS Kinesis Data Analytics, AWS Lambda, or Amazon ECS to process the raw data.
- Store the processed data: Store the processed data in a database that Grafana can directly query (like Amazon Timestream, Amazon RDS, or Amazon OpenSearch Service).
- Connect Grafana to the processed data source: Add the new database as a data source in Grafana.
- Create dashboards based on the processed data: Build panels in Grafana that query and visualize the processed data in real time.
Conclusion:
Building a real-time dashboard doesn’t have to be a complex undertaking. By leveraging the power of AWS Kinesis for data ingestion and Amazon Managed Grafana for visualization, you can quickly gain valuable insights from your streaming data. While this 10-minute setup focuses on monitoring the Kinesis stream itself, it’s the first crucial step towards building more sophisticated real-time dashboards with your actual data. Start exploring and unlock the power of live data visualization!